
What Does a Tree Actually Do?

A tree's climate, oxygen, and water impact depends entirely on how it's planted, not just whether it's planted. Per-tree carbon ranges from 5 kg CO₂/yr in Miyawaki to 22 kg CO₂/yr in agroforestry, but per-hectare carbon reverses this: Miyawaki reaches 125 tonnes CO₂/yr, nearly 9× agroforestry, showing why planting method fundamentally shapes a tree's contribution.
CARBON & CLIMATE SCIENCE
What Does a Tree Actually Do?
The real impact of one tree, across four ways of planting it. With the IPCC formulas, peer-reviewed Indian field data, and the calculations behind every number.
12 minute read · Updated May 2026 · Grow Billion Trees Research
THE 60-SECOND VERSION
• A tree's climate, oxygen, and water impact depends entirely on how it's planted, not just whether it's planted.
• Per-tree carbon is highest in Agroforestry (22 kg CO₂/yr) and lowest in Miyawaki (5 kg CO₂/yr).
• Per-hectare carbon flips the ranking — Miyawaki dominates at 125 t/ha/yr, nearly 9× Agroforestry.
• Both numbers are correct. They answer different questions. Mixing them up is how greenwashing happens.
• This post walks through six measurable parameters with the IPCC formulas and references you can audit.
When a corporate CSR team commits to "planting 10,000 trees," what does that actually mean in tonnes of CO₂, kilograms of oxygen, or litres of water? The honest answer is: it depends entirely on how those trees are planted.
A tree in a Miyawaki forest, a tree in a farmer's agroforestry plot, a tree in a coastal mangrove, and a tree in a conventional plantation are doing four very different jobs. They sequester different amounts of carbon. They release different amounts of oxygen. They use different amounts of water. They live in different ecological neighbourhoods.
At Grow Billion Trees, we've spent the last two and a half years planting across all four methodologies for over 200 corporate clients. Along the way, we've had to answer some uncomfortable questions from sophisticated CSR auditors at companies like L&T, Tata, and Infosys: Where do your numbers come from? Why do they differ from what we read elsewhere? Can you defend them in front of a Big-4 verifier?
This post is our attempt to answer those questions in public — with the calculations, the references, and the caveats. If you're a CSR lead, an ESG analyst, a sustainability consultant, or just someone who genuinely wants to understand what tree planting accomplishes, this is the piece I wish existed when I started.
01 · The Foundation: Photosynthesis, Glucose & Wood
Every climate impact a tree creates traces back to a single chemical equation — the most important reaction in biology:
6 CO₂ + 6 H₂O + sunlight → C₆H₁₂O₆ + 6 O₂
The mass balance
Look at the molecular weights — the math is exact:
• 6 × CO₂ = 6 × 44 = 264 grams of CO₂ absorbed
• 6 × H₂O = 6 × 18 = 108 grams of water consumed
• 1 × C₆H₁₂O₆ = 180 grams of glucose produced
• 6 × O₂ = 6 × 32 = 192 grams of oxygen released
Six molecules of carbon dioxide combine with six molecules of water, powered by sunlight, to produce one molecule of glucose (C₆H₁₂O₆) and release six molecules of oxygen. Glucose is the building block of cellulose, hemicellulose, and lignin — the three components that make up wood. So when we say "a tree sequesters carbon," what we mean precisely is: the tree pulled CO₂ from the atmosphere, used the carbon to build glucose, polymerised the glucose into wood, and released the oxygen as a by-product.
Out of every 264 g of CO₂ absorbed, the carbon (72 g) is locked into the tree, while the oxygen (192 g) returns to the atmosphere. For every 1 kg of CO₂ a tree sequesters, it releases roughly 0.73 kg of oxygen — pure stoichiometry, unchangeable physics.
A tree is, fundamentally, a machine for converting atmospheric CO₂ into wood through this reaction. The wood is biomass. Biomass is roughly 47% carbon by dry weight. And every kilogram of carbon in that wood corresponds to 3.67 kilograms of CO₂ pulled from the atmosphere — that's the molecular weight ratio of CO₂ to C (44 ÷ 12).
The problem is that "how much biomass a tree adds in a year" depends enormously on the tree's neighbours. A tree planted alone in a farmer's field develops a wide canopy, deep individual roots, and grows fat with annual increments of 8–15 kg of above-ground biomass. The same species planted with 24,999 of its closest relatives in a Miyawaki forest grows tall and slender, racing for sunlight, and adds only 1–3 kg of biomass per year individually — even though the forest as a whole grows much faster than any conventional plantation.
Per-tree and per-hectare numbers tell completely different stories. Both are true. Both are useful. Mixing them up is how greenwashing happens.
02 · The Four Methodologies
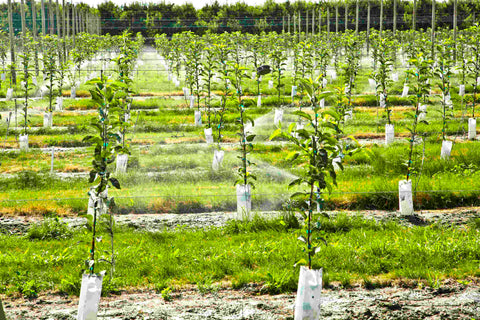
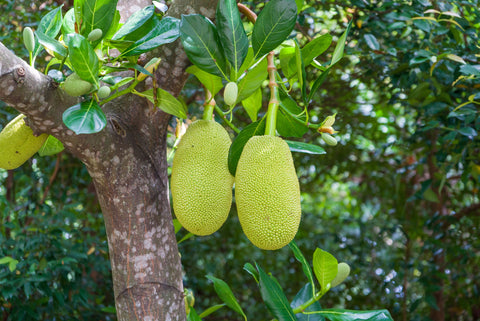
Agroforestry integrates trees into farmland — boundary planting, shade trees over crops, alley cropping, silvopasture. Density is low (around 650 trees per hectare in our typical Indian projects), trees grow large and individually impressive, and the system supports both biodiversity and farmer livelihoods. In India, the species portfolio typically includes Mango (Mangifera indica), Jackfruit (Artocarpus heterophyllus), Teak (Tectona grandis), and Mahogany (Swietenia macrophylla) — all species that thrive with space, deep soils, and the long-term tenure of farmer-managed land.
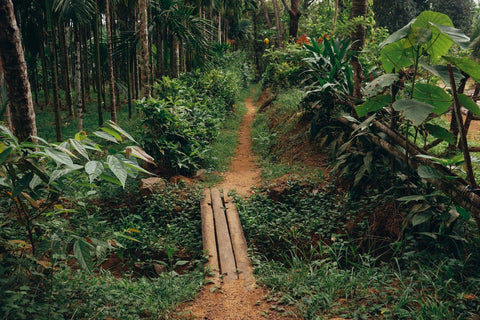
Miyawaki forests were pioneered by Japanese botanist Akira Miyawaki in the 1970s. The technique uses dense planting (25,000–30,000 trees per hectare) of native species in deeply prepared soil. Trees compete intensely, grow rapidly upward, and form a closed-canopy forest in 10–15 years instead of the 100+ years a natural forest would take.
Mangroves grow in coastal saline mudflats, with extraordinary root systems that anchor coastlines, buffer storm surges, and store carbon at rates 4× higher than upland forests when you include the soil. Density is moderate (around 2,500 trees per hectare in restoration projects).
Conventional plantation is the classic block planting model: uniform spacing (typically 3m × 3m, giving 1,100 trees per hectare), often single-species, used historically for timber but increasingly for ecological restoration.
03 · Above-Ground Biomass: How Much Wood Each Tree Adds
Above-Ground Biomass (AGB) is the foundational measurement — every other number in this post derives from it.
|
Project Type |
AGB (kg/tree/yr) |
Density (trees/ha) |
AGB per hectare (t/ha/yr) |
|
Agroforestry |
10 |
650 |
6.5 |
|
Miyawaki |
2 |
25,000 |
50 |
|
Mangrove |
6 |
2,500 |
15 |
|
Conventional |
8 |
1,100 |
8.8 |
The Agroforestry tree is the muscle car — high individual output, generous spacing, big canopy. A Mango (Mangifera indica) or Jackfruit (Artocarpus heterophyllus) tree in an open agroforestry plot adds about 10 kg of dry biomass per year. Teak (Tectona grandis) and Mahogany (Swietenia macrophylla) are similar but shape differently — taller, more columnar, less crown — and they keep adding biomass well past year 20.
The Miyawaki tree is a teenager in a crowded room — only 2 kg per year individually, but the forest collectively adds 50 tonnes of biomass per hectare per year. To put that in perspective, the densest old-growth tropical forests in the Western Ghats accumulate biomass at around 6–8 t/ha/yr at maturity. A young Miyawaki forest in its peak years (years 3–6) can grow seven times faster than that.
The mangrove tree sits in the middle, with 6 kg of above-ground biomass — but this number undersells mangroves significantly because their root systems are massive. Mangroves invest 30–50% of their biomass below ground in prop roots and pneumatophores. The conventional tree at 8 kg/yr is the workhorse — predictable, well-studied, with 50+ years of forestry literature backing the numbers.
REFERENCES Sankar et al. (2025) ATREE/IIT Palakkad Miyawaki study; Dhyani et al. (2016) ICAR agroforestry review; Komiyama et al. (2008) mangrove allometry; IPCC (2019) Vol. 4, Ch. 4.
04 · Canopy Cover: How Much Sky Each Tree Owns
Canopy cover matters for everything from urban heat reduction to bird nesting habitat to the amount of shade your project provides. The math is mostly geometric: if you plant trees 4 metres apart, no individual tree can ever own more than 16 m² of ground.
|
Project Type |
Canopy (m²/tree) |
What it looks like |
|
Agroforestry |
15 |
Wide-spaced trees, large crowns |
|
Miyawaki |
3 |
Dense, narrow individual canopies |
|
Mangrove |
5 |
Moderate spacing, modest crowns |
|
Conventional |
15 |
Standard 3m × 3m grid |
The Agroforestry tree at 15 m² is the size of one and a half parking spaces. A mature Mango tree shelters crops below, hosts dozens of bird species, and cools the soil. A Jackfruit canopy similarly supports a layered ecosystem. Teak and Mahogany develop more upright crowns but still settle around the 15 m² mark. This is why agroforestry trees are often the most beloved by the farmers who live with them.
The Miyawaki tree at 3 m² is mathematically constrained — at 25,000 trees per hectare, each tree gets 0.4 m² of ground footprint. The "canopy" extends through vertical layering rather than horizontal spread. The mangrove tree at 5 m² is shaped by salt and tide; mangrove crowns stay relatively compact, the action is in the roots. The conventional plantation tree at 15 m² is the classic shade tree silhouette — round, full, well-spaced. This is what most people picture when they think "tree."
05 · The 20-Year Reporting Horizon
This isn't a measured parameter — it's a methodological choice. We use a 20-year horizon for impact reporting across all four methodologies because that's the standard set by Verra VCS, Gold Standard, and the IPCC AR6 default permanence window for reforestation projects.
Why does this matter? Because trees keep sequestering carbon long after year 20. Mango and Jackfruit trees in agroforestry can live and accumulate biomass for 50–80 years. Teak and Mahogany live longer still. Mangroves can persist for centuries when undisturbed. A 20-year horizon understates total lifetime impact — but it matches what voluntary carbon markets, BRSR-aligned reporting, and Big-4 ESG verifiers expect.
When we report "300 tonnes of CO₂ sequestered over 20 years," that's a conservative number. The actual long-term sequestration of those same trees over their full biological lifetime is substantially higher. We choose conservatism over generosity because credibility is the most valuable asset in carbon reporting.
REFERENCES Verra VM0047 methodology; Gold Standard A/R framework; IPCC AR6 WG3 guidelines.
06 · CO₂ Sequestration: The Headline Number
This is the number every corporate sustainability report wants. It's also the number most often misrepresented. Let me show you the calculation, then the values.
The IPCC formula
CO₂ sequestered = AGB × Carbon Fraction × CO₂/C ratio × (1 + Root:Shoot ratio)
= AGB × 0.47 × 3.67 × (1 + R)
The carbon fraction (0.47) is the IPCC tropical default — trees are 47% carbon by dry mass. The CO₂/C ratio (3.67) is the molecular weight conversion: a CO₂ molecule weighs 44, of which carbon contributes 12. The root-to-shoot ratio (R) varies by project type because different trees invest differently in roots.
Consolidated into a single multiplier per project type:
|
Project |
Root:Shoot |
Multiplier |
Source |
|
Agroforestry |
0.27 |
× 2.2 |
IPCC tropical default |
|
Miyawaki |
0.16 |
× 2.0 |
Lower due to crowding |
|
Mangrove |
0.50 |
× 2.5 |
Mokany et al. (2006) |
|
Conventional |
0.27 |
× 2.2 |
IPCC tropical default |
Apply the multipliers to AGB and you get the per-tree and per-hectare CO₂ sequestration values:
|
Project |
AGB |
× |
CO₂ kg/tree/yr |
Trees/ha |
CO₂ t/ha/yr |
|
Agroforestry |
10 |
2.2 |
22 |
650 |
14.3 |
|
Miyawaki |
2 |
2.0 |
5 |
25,000 |
125 |
|
Mangrove |
6 |
2.5 |
15 |
2,500 |
37.5 |
|
Conventional |
8 |
2.2 |
18 |
1,100 |
19.8 |
The per-hectare math is straightforward: per-tree CO₂ × density ÷ 1000 (to convert kg to tonnes). For Conventional: 18 × 1,100 ÷ 1,000 = 19.8 t CO₂/ha/yr.
THE INSIGHT EVERYONE MISSES
The same four methodologies. Two completely different rankings.
|
Per Tree (kg CO₂/yr) — Agroforestry wins |
Per Hectare (t CO₂/yr) — Miyawaki wins |
|
🥇 Agroforestry — 22 kg |
🥇 Miyawaki — 125 t |
|
Conventional — 18 kg |
Mangrove — 37.5 t |
|
Mangrove — 15 kg |
Conventional — 19.8 t |
|
Miyawaki — 5 kg |
Agroforestry — 14.3 t |
Per tree, Agroforestry wins handily — 22 kg of CO₂ per tree per year, more than 4× a Miyawaki tree. Per hectare, Miyawaki destroys everything else — 125 tonnes of CO₂ per hectare per year, nearly 9× an Agroforestry plot.
Which is "better"? Neither. They're solving different problems. Agroforestry is climate-positive farmland; Miyawaki is climate-dense forest. If you have 100 hectares of farm land where farmers will continue growing Mango, Jackfruit, and intercropped vegetables, agroforestry adds 1,430 tonnes of CO₂ sequestration per year on top of food production. If you have 1 hectare of urban land that needs to become forest, Miyawaki gives you 125 tonnes per year on that single hectare.
The right tool depends on the right context. Anyone telling you Miyawaki is "30× better than conventional plantation" is giving you a true number with a misleading frame.
REFERENCES IPCC (2019) Vol. 4, Ch. 4; Mokany et al. (2006) Global Change Biology; Sankar et al. (2025) — peak-year Miyawaki figure of 121 t CO₂/ha/yr at year 5 from ATREE/IIT Palakkad; Dhyani et al. (2016) ICAR review of Indian agroforestry; MIT Climate Portal (2024).
07 · Oxygen Production: The Number Everyone Quotes
Walk into any corporate office with a sustainability poster and you'll see the famous claim: "One tree produces enough oxygen for two people for a year." The number behind that claim is 118 kg of O₂ per tree per year (260 lbs in US units), originally published by the Arbor Day Foundation and the US Forest Service.
That number is correct — for a fully mature, healthy, peak-production urban shade tree. It is not correct for a 20-year project average across all trees of all ages.
The honest derivation
6 CO₂ + 6 H₂O → C₆H₁₂O₆ + 6 O₂
1 kg biomass contains 0.5 kg carbon
1 kg biomass requires 1.25 kg of glucose (C₆H₁₂O₆)
1 kg of glucose produces 192/180 = 1.067 kg O₂
(6 O₂ at 32 g each = 192 g; 1 glucose = 180 g)
Therefore: 1 kg biomass → 1.33 kg O₂ released
With roots: 1 kg AGB → ~5.45 kg O₂ (annual flux scaled)
So the multiplier is roughly O₂ = AGB × 5.45 for upland forests, × 6.0 for mangroves.
|
Project Type |
AGB |
× Multiplier |
O₂ kg/tree/yr |
O₂ kg/ha/yr |
|
Agroforestry |
10 |
× 5.45 |
55 |
35,750 |
|
Miyawaki |
2 |
× 5.45 |
11 |
275,000 |
|
Mangrove |
6 |
× 6.0 |
36 |
90,000 |
|
Conventional |
8 |
× 5.45 |
44 |
48,400 |
The famous 118 kg/tree/yr corresponds to a mature tree adding ~22 kg of biomass per year — a peak Mango or Mahogany tree at year 15+ in optimal conditions. That's the upper bound. Our numbers (44–55 kg for upland forests) represent a 20-year project average, which includes the slow first 3 years and the post-peak plateau.
A mature Miyawaki forest produces around 275,000 kg of oxygen per hectare per year — enough for 500 people based on the 550 kg/person/year human consumption figure. A single hectare. That's the magic of density done right.
Humans don't actually need trees for oxygen. The atmosphere has enough to last us thousands of years even if all photosynthesis stopped tomorrow. Lead with carbon; mention oxygen as the elegant chemistry that comes free.
REFERENCES Arbor Day Foundation / US Forest Service "260 lbs O₂ per tree" canonical figure; Nowak, Hoehn, Crane (2007) Arboriculture & Urban Forestry; McAliney (1993) Trust for Public Land; Salisbury & Ross (1992) Plant Physiology; Janesky (2024) Energy Resource Dynamics.
08 · Water Retention: The Soft But Critical Number
Water is where every tree-related number gets fuzzy, because "water retained" can mean three completely different things — interception (rainwater caught on leaves), recharge contribution (water that soaks into soil rather than running off), and transpiration savings (water that doesn't evaporate from soil because tree shade keeps it cool). Most published figures conflate these.
|
Project Type |
L/tree/yr |
L/ha/yr |
Olympic pools/ha/yr |
|
Agroforestry |
300 |
195,000 |
0.08 |
|
Miyawaki |
60 |
1,500,000 |
0.60 |
|
Mangrove |
400 |
1,000,000 |
0.40 |
|
Conventional |
180 |
198,000 |
0.08 |
Agroforestry trees (300 L/tree/yr) are the heroes of farmland water cycles. Mango and Jackfruit roots reach deep, drawing water from below and creating shaded microclimates above. Teak and Mahogany contribute through leaf litter that improves soil moisture retention. ICRAF studies in semi-arid India consistently show 250–400 litres of net water service per tree per year.
Miyawaki forests (60 L/tree/yr individually, but 1.5 million L/ha) are powerful at the system level. The dense canopy intercepts rainfall, the rapid root development creates underground sponges, and the litter layer holds moisture year-round.
Mangroves (400 L/tree/yr) don't really "retain" freshwater in the upland sense — they live in saltwater. The number captures their massive ecosystem service value: sediment trapping, salinity buffering, storm surge mitigation. Conventional plantations (180 L/tree/yr) are the standard rule of thumb — USDA-derived, applied widely.
REFERENCES ICRAF (World Agroforestry Centre) hydrology studies; Central Ground Water Board (CGWB) groundwater recharge methodology; IUCN mangrove ecosystem services valuation; USDA Forest Service urban tree water budget studies.
09 · Putting It All Together: 1,000 Trees, 20 Years
Imagine you sponsored 1,000 trees through Grow Billion Trees, distributed equally across our four methodologies (250 each). Over the 20-year reporting horizon, here's what those trees do, summed across the portfolio:
|
Impact |
Total over 20 years |
Equivalent |
|
CO₂ sequestered |
300 tonnes |
Lifetime emissions of 65 cars |
|
Oxygen released |
730 tonnes |
Supports 1,327 people for a full year |
|
Water cycled |
4.7 million litres |
Nearly two Olympic pools' worth |
|
Canopy created |
9,500 m² |
About 1⅓ football fields of new shade |
One tree, on average across the four methodologies, sequesters 15 kg of CO₂ per year, produces 36 kg of oxygen, cycles 235 litres of water, and creates 9.5 m² of canopy. Over a 20-year project lifetime, that's 300 kg of CO₂, 720 kg of oxygen, 4,700 litres of water, and a permanent contribution to the canopy of the place where it grows.
That's the impact of a tree.
10 · What This Doesn't Capture
Numbers always lie a little, even honest ones. Three things this analysis misses:
Biodiversity. A Miyawaki forest with 30 native species supports an ecological community that no per-hectare CO₂ number can capture. A mangrove forest is nursery to fish stocks worth crores of rupees in coastal economies. An Agroforestry plot of Mango, Jackfruit, Teak, and Mahogany supports pollinators that feed surrounding crops.
Soil carbon. Mangroves in particular store enormous quantities of carbon in their soils — Donato et al. (2011) found mangroves contain 1,023 tonnes of carbon per hectare total, four times more than upland tropical forests, with most of it in the soil. Our biomass-only numbers undercount mangrove climate impact by 50–80%.
Time and survival. The numbers assume project survival rates of 75–85%. The difference between an 85% survival project and a 50% survival project is, climate-wise, the difference between climate solution and climate theatre. This is why we monitor every project for 5 years through GreenTrack, our geo-tagged transparency platform.
11 · Three Things to Take Away
First, the right number depends on the right question. Per-tree numbers are useful for sponsorship narratives — "your 100 trees sequester 2.2 tonnes of CO₂ per year." Per-hectare numbers are useful for land-use planning — "this 5-hectare Miyawaki forest will sequester 625 tonnes per year." Mixing them is greenwashing, even when accidental.
Second, methodology matters more than count. Ten thousand trees in a Miyawaki forest, 10,000 trees in an Agroforestry plot of Mango and Jackfruit, and 10,000 trees in a mangrove restoration project will deliver wildly different impact profiles over 20 years. A serious CSR program picks methodology to match desired outcomes — not the other way around.
Third, transparency beats marketing. Every number in this post has a citation. Every multiplier has a source. Every project we run can be traced to specific GPS coordinates on our GreenTrack dashboard. If a tree-planting partner won't show you the math, the math probably doesn't add up.
The trees are doing their work. Our job — yours, ours, every CSR team's — is to make sure the impact we claim matches the impact they actually deliver.
Frequently Asked Questions
How is carbon sequestration per tree calculated?
The IPCC formula is: CO₂ = AGB × Carbon Fraction × CO₂/C ratio × (1 + Root:Shoot ratio). Using 0.47 carbon fraction, 3.67 stoichiometric ratio, and 0.27 root:shoot ratio for tropical species, the multiplier is approximately 2.2. Multiply your tree's annual above-ground biomass increment in kg by 2.2 to get CO₂ sequestered in kg per year.
Why does a Miyawaki tree sequester less CO₂ than an Agroforestry tree?
Because of dense planting. A Miyawaki forest packs 25,000 trees per hectare versus 650 for Agroforestry. Each individual tree competes intensely for light and water, growing tall and slender rather than fat and wide. Per tree, output is lower; per hectare, total output is much higher.
What's the right way to compare tree planting projects?
Match the metric to the project type. Use per-hectare numbers for Miyawaki and other high-density plantings. Use per-tree numbers for Agroforestry where individual trees are the unit of value. Always check both numbers — if they tell consistent stories, the project is honest; if one is highlighted while the other is hidden, ask why.
Why is the CO₂ reporting horizon 20 years?
It's the standard set by Verra, Gold Standard, and the IPCC. Trees keep sequestering carbon for 50–100+ years, but voluntary carbon markets and BRSR-aligned reporting frameworks use 20 years for permanence and credibility.
Do trees really produce oxygen for 2 humans?
Only mature peak trees, and only by a specific gross-production calculation. The headline "1 tree = 2 humans of oxygen" comes from the Arbor Day Foundation's 118 kg O₂/tree/year figure, which represents a fully mature urban shade tree. Project-average values are lower (44–55 kg/tree/year for upland forests). And humans don't actually need trees for atmospheric oxygen — the climate impact is the real value.
References
Methodology & Formulas
1. IPCC (2019). Refinement to the 2006 IPCC Guidelines for National Greenhouse Gas Inventories, Vol. 4, Ch. 4: Forest Land. Geneva: IPCC.
2. Mokany, K., Raison, R.J., Prokushkin, A.S. (2006). "Critical analysis of root:shoot ratios in terrestrial biomes." Global Change Biology, 12(1): 84–96.
3. Verra (2024). VM0047: Afforestation, Reforestation, and Revegetation Methodology, v1.1.
Agroforestry
1. Dhyani, S.K., Newaj, R., Handa, A.K., et al. (2016). "Potential of agroforestry systems in carbon sequestration in India." Indian Journal of Agricultural Sciences, 86(9): 1103–1112.
2. Chavan, S.B., et al. (2023). "Carbon Sequestration Potential of Commercial Agroforestry Systems in Indo-Gangetic Plains of India." Forests, 14(3): 559.
Miyawaki
1. Sankar, S.M.U., et al. (2025). "Assessing carbon sequestration in urban Miyawaki forests of south India." Trees, Forests and People. DOI: 10.1016/j.tfp.2025.100728.
2. Senthilkumar, D., Bharathidhasan, A. (2024). "Estimation of Carbon Sequestration Potential under Miyawaki Planting Method." Biological Forum, 16(11): 163–167.
3. Miyawaki, A. (1999). "Creative ecology: restoration of native forests by native trees." Plant Biotechnology, 16(1): 15–25.
Mangroves
1. Komiyama, A., Ong, J.E., Poungparn, S. (2008). "Allometry, biomass, and productivity of mangrove forests: A review." Aquatic Botany, 89(2): 128–137.
2. Donato, D.C., et al. (2011). "Mangroves among the most carbon-rich forests in the tropics." Nature Geoscience, 4: 293–297.
3. Vinod, K., et al. (2020). "Biomass and carbon stocks in mangrove ecosystems of Kerala, southwest coast of India." Ecological Processes, 9: 31.
Conventional Plantation
1. Bernal, B., Murray, L.T., Pearson, T.R.H. (2018). "Global carbon dioxide removal rates from forest landscape restoration activities." Carbon Balance and Management, 13: 22.
2. Forest Survey of India (2021). India State of Forest Report 2021. Dehradun: FSI.
3. MIT Climate Portal (2024). "A Supply Curve for Forest-Based CO2 Removal."
Oxygen & Stoichiometry
1. Nowak, D.J., Hoehn, R., Crane, D.E. (2007). "Oxygen Production by Urban Trees in the United States." Arboriculture & Urban Forestry, 33(3): 220–226.
2. McAliney, M. (1993). Arguments for Land Conservation. Trust for Public Land.
3. Salisbury, F.B., Ross, C.W. (1992). Plant Physiology, 4th ed. Wadsworth Publishing.
Water & Ecosystem Services
1. ICRAF (World Agroforestry Centre) hydrology studies for Indian semi-arid systems.
2. Central Ground Water Board (CGWB), India — groundwater recharge methodology.
3. IUCN — Mangrove ecosystem services valuation framework.
Plant trees that actually do the math
Grow Billion Trees runs Agroforestry, Miyawaki, and Mangrove restoration projects across India for 200+ corporate clients. Every tree we plant is geo-tagged and tracked through GreenTrack — our transparency platform. If you have feedback on the numbers in this post, we'd genuinely like to hear it. Transparency only works if it's two-way.
Further reading: How Much CO2 Can One Tree Absorb? Complete Guide to Carbon Capture · The Marvels of Carbon Sequestration: Nature's Climate Solution
Frequently Asked Questions
What is the difference between per-tree and per-hectare carbon absorption?
Per-tree carbon measures how much one individual tree absorbs annually, while per-hectare carbon measures total absorption across all trees on one hectare of land. Agroforestry has the highest per-tree carbon at 22 kg CO₂/yr, but Miyawaki has the highest per-hectare carbon at 125 tonnes CO₂/yr. Both numbers are correct but answer different questions.
How much CO₂ does a tree absorb per year in different planting methods?
Carbon absorption varies significantly by planting method. In Miyawaki forests, a tree absorbs about 5 kg CO₂/yr per tree, while in agroforestry systems, it absorbs about 22 kg CO₂/yr per tree. These figures come from IPCC formulas and peer-reviewed Indian field data.
Why does the way you plant trees matter more than just planting them?
A tree's impact on climate, oxygen, and water depends entirely on how it's planted, not just whether it's planted. The same tree can produce vastly different environmental results depending on whether it's planted in a Miyawaki forest, agroforestry plot, coastal mangrove, or conventional plantation.
Which tree-planting method absorbs the most carbon per hectare?
Miyawaki forests reach 125 tonnes of CO₂ absorption per hectare per year, nearly 9 times higher than agroforestry systems. This makes Miyawaki the most effective planting method for maximizing carbon sequestration on limited land.
How does greenwashing happen with tree-planting claims?
Greenwashing in tree planting occurs when companies confuse per-tree carbon figures with per-hectare figures in marketing claims. Mixing up these two metrics misrepresents a planting project's actual environmental impact, even though both numbers can be correct.


Leave a comment